Alan Maguire
Adding inlined functions to the BPF Type Format
Introduction
One of the common pain points for kernel tracing is when we attempt to attach tracing to a function and attachment fails. This failure can happen for a number of reasons, and once we have understood these we will be in a better position to see the value of having inline function information.
The problem of missing functions
Here we discuss some of the reasons you may not be able to trace a function.
1. “notrace”/”noinstr” functions
Problem
The function itself is marked “notrace” or “noinstr” ; this is the case for functions that are themselves invoked as part of the tracing infrastructure. As you can imagine, tracing a function which then fires again because you are tracing, leading to a further firing and so on is a big problem.
Diagnosis
A function is in /proc/kallsyms but not in /sys/kernel/tracing/available_filter_functions.
Solution
Instead of relying on /proc/kallsyms to find traceable functions,
use /sys/kernel/tracing/available_filter_functions, or even
better /sys/kernel/tracing/available_filter_functions_addrs which
has both function address, name and optional module:
$ sudo cat cat /sys/kernel/tracing/available_filter_functions_addrs
ffffffff84000014 trace_initcall_level_cb
ffffffff84000044 trace_initcall_start_cb
ffffffff84000100 run_init_process
ffffffff84000210 try_to_run_init_process
It is not possible to trace these notrace functions, but at least we can see which ones they are.
2. Optimized functions with changed function signatures
Problem
To attach BPF tracing using fentry/fexit, it is vital that the BPF
Type Format (BTF) information contains the function signature
as a BTF_KIND_FUNC/FUNC_PROTO; without this the verifier cannot
safely attach to the function. For optimized functions which omit
parameters or have their parameters in unexpected locations rather
than the expected registers from the ABI, BTF is often omitted.
Diagnosis
Determine if the function made it into BTF:
$ bpftool btf dump file /sys/kernel/btf/vmlinux |grep myfunc
...
If the kernel was built with gcc, optimized functions will have
a .isra or .constprop suffix, for example crypt_iv_tcw_whitening.isra.0.
Solution
Instead of fentry/fexit, use kprobe tracing instead, and be aware that the parameters may not be in the registers you expect.
3. Inlined functions
Problem
Compilers make all sorts of choices to optimize the objects they generate. One big win is inlining, where a function - potentially called in many different places - has its body placed into the body of the caller(s). This saves on function call overhead and inlining is extensive in modern environments.
To give a sense of this, consider the numbers for just the kernel vmlinux image itself.
On a representative distro kernel, I see around 50,000 un-inlined and available to trace functions, while there are about 40,000 functions that were inlined to about 400,000 sites.
That is we see nearly 10x inline sites vs available-to-trace functions.
You can see this by examining the kernel source; the “inline” hint
is used extensively (especially in headers containing small functions)
and __always_inline - which tries to ensure the function is inlined
rather than hinting to the compiler to do so - is used frequently too.
Diagnosis
The function is not in /proc/kallsyms.
Solution
None, aside from changing the code to avoid inlining. Tricks include making a function non-static, though even this breaks with a Link-Time Optimized (LTO) kernel.
Summing up
Below we categorize the set of functions on a Fedora 43-based kernel. We can see that the vast majority of the missing functions have been inlined.
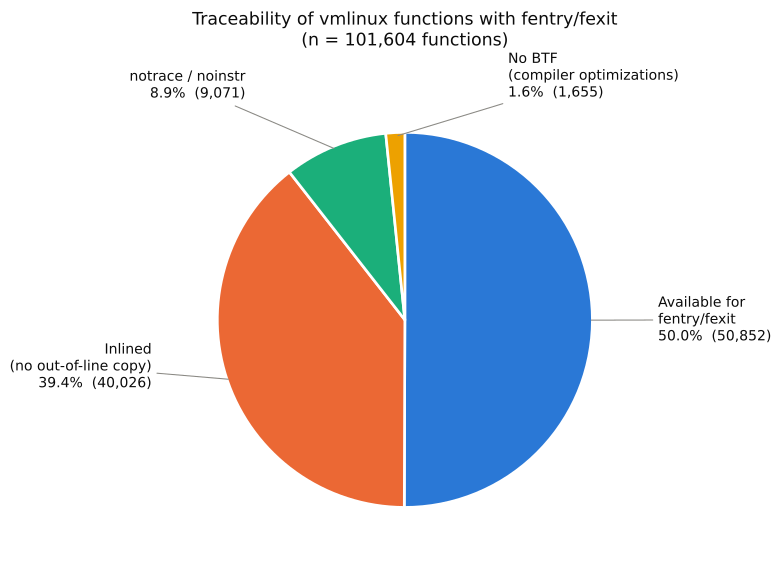
| Category | Functions | % |
|---|---|---|
| Available for fentry/fexit | 50,852 | 50.0% |
| Inlined (no out-of-line copy) | 40,026 | 39.4% |
| notrace / noinstr | 9,071 | 8.9% |
| No BTF (compiler optimizations) | 1,655 | 1.6% |
| Total | 101,604 | 100% |
Some good news
It is possible to trace at an inline site using a kprobe. kprobes can trace at most instructions (unlike fentry/fexit), but the problem is that the only place we have information about inlining is in the DWARF debuginfo which is hundreds of megabytes and often not available on a system like BTF is. BTF is found in /sys/kernel/btf and is baked into the kernel image rather than being a separate installable package like DWARF debuginfo.
So if we had a way to compactly represent the 400,000 inline sites we could trace them. However with 400,000 of anything the representation needs to be as compact as possible - how to proceed?
Steps towards a solution
So our aim is to add BTF kinds to the BPF Type Format to support inlining. The representation chosen will need to be as compact as possible given the number of inline sites, but at a minimum we want to connect
- the address of an inline site;
- the function that was inlined;
- the parameters to the inlined function, if available
A key part of what makes BTF compact is de-duplication; where duplicate
information is removed as part of BTF encoding. De-duplication of
identical structures for example means we wind up with a single
struct sk_buff rather than a copy in each object file that makes
up the kernel and uses sk_buffs.
So to minimize the representation of inlines we want to ensure that the representation is designed to take advantage of de-duplication.
But before getting to that, a few additional changes were needed in and around BTF.
1. Describing the describer - BTF kind layout information
We have seen that BTF is used to describe the set of types and functions associated with an object. And as part of the inline work we want to introduce new BTF kinds to cover inline sites and how to locate their parameters.
One problem we wanted to tackle is that it is painful every time
a new BTF_KIND_* is introduced as all the tooling needs to learn
about it. An unfortunate fact is that in order to parse BTF, it
was necessary to know how all the kinds in that BTF were laid out.
So if a new kind was introduced, older tools that did not know about
it just gave up.
As a pre-requisite, this series fixed this; it allows BPF tooling to read a “kind layout” section in BTF which informs users about all the kinds that can potentially be in that BTF. This means that BTF can still be parsed by older tools (as long as they support the kind layout reading!), even if they do not know about new kinds.
2. Supporting multi-split BTF
One issue around inline info is we want to use split BTF to store it,
i.e. a separate BTF object that sits on top of non-inline-related
vmlinux BTF. Split BTF is already supported for modules, but because
module BTF is already split relative to vmlinux BTF - to ensure that
each module does not need to carry a struct sk_buff representation -
we will need multi-split BTF to represent module inline info. In other
words inline info for the xfs module in /sys/kernel/btf/xfs.inline
is split relative to non-inline-related BTF in /sys/kernel/btf/xfs
which in turn is split on top of vmlinux BTF in /sys/kernel/btf/vmlinux.
Thankfully not much was needed to support multi-split BTF; a few small fixes like this one were all that was needed.
3. Extending BTF vlen, kind fields
The next problem was we want to collect information about inline sites
in an ELF section - for example .text - in a BTF_KIND_LOCSEC location
section; each entry consists of
- the type id of the associated function (BTF_KIND_FUNC)
- the type id of the associated location prototype (BTF_KIND_LOC_PROTO); it consists of a set of BTF_KIND_LOC_PARAM, one for each parameter which tells us where the parameter is to be found (in a register, on the stack or not at all when set to 0).
- the 32-bit offset of the location site relative to the ELF section start address
The problem is that we saw above that .text can have 400,000 of these, and
the struct btf_type that represents the information about a BTF kind
looks like this:
struct btf_type {
	__u32                      name_off;             /*     0     4 */
	__u32                      info;                 /*     4     4 */
	union {
		__u32              size;                 /*     8     4 */
		__u32              type;                 /*     8     4 */
	};                                               /*     8     4 */

	/* size: 12, cachelines: 1, members: 3 */
	/* last cacheline: 12 bytes */
};
The info field consisted of
- bits 0–15: vlen, the count of members, params, enumerators, etc
- bits 16–23: unused.
- bits 24–28: kind, which allows 32 kinds.
- bits 29–30: unused.
- bit 31: kind_flag, whose meaning depends on the kind (bitfield members, forward union vs struct, signed enums, and so on).
The problem is that because we only had 16 bits to represent vlen, it artificially limited the LOCSEC to 65535 entries. As a result we extended the vlen field to use unused bits, and also extended the kind bits to allow for more kinds in the future. The updated layout:
- bits 0–23: vlen. Maximum becomes 0x00ffffff (about 16.7M).
- bits 24–30: kind, widened from 5 to 7 bits, which allows 128 kinds.
- bit 31: kind_flag, unchanged.
With this new layout we can easily express the number of inline sites we need.
4. Inline support in libbpf, pahole
Now that we have the pre-requisites done, we are in a position to update the BTF representation to add BTF kinds to support inline representations. This series takes care of that.
The representation adds the following kinds:
-
BTF_KIND_LOC_PARAM is used to represent how we retrieve data at a location; either via register(s), or register+offset, a dereference of a register+offset or a constant value.
-
BTF_KIND_LOC_PROTO represents location information about a location with multiple BTF_KIND_LOC_PARAMs.
-
And finally BTF_KIND_LOCSEC is a set of location sites, each of which has
- a BTF_KIND_FUNC function associated with the inline site
- a location prototype specifying where to find the function parameters
- an address offset relative to the kernel base address
This representation can be used to support representing
- a fully-inlined function at potentially multiple inline sites with potentially different parameter availability
- a partially-inlined function where some _LOC_PROTOs represent inlined sites as above and others have normal _FUNC representations
Critically, it is crafted to maximize BTF deduplication. By separating the identity of the function from LOC_PARAM/LOC_PROTO, we aim to de-duplicate these heavily, while the function identity is stored in the LOCSEC entries which cannot be deduplicated anyway.
Once the above support was added to libbpf, it could be used in pahole. This series generates inline information along with the rest of the BTF information about an object if –btf_features=inline is specified.
5. Inline support in the kernel - kbuild support
Now that we have support for generating inline information via pahole,
the final step is to do that generation during a kernel build. One
complication is we wish to separate out the inline and non inline-related
BTF since the inline info can be quite large. Eduard Zingerman came
up with a neat way to do this in the resolve_btfids command and it
is a part of the kbuild series.
If CONFIG_DEBUG_INFO_BTF=y, a .BTF.inline ELF section is added to
vmlinux and modules, and made available in /sys/kernel/btf/<object>.inline.
However since vmlinux.inline information is around 10Mb uncompressed, we also
support CONFIG_DEBUG_INFO_BTF=m which places vmlinux inline info
in btf_vmlinux_inline.ko, a module that is loaded on-demand when inline
info is accessed.
Using inline information to trace inlined functions
The next step is to use this information! Jiri Olsa is looking at using it in kprobe multi tracing, we can look forward to more progress in this area soon.